
You're exporting QuickBooks data into Google Sheets every month, rebuilding the same variance formulas, and hoping the columns still line up. There's a faster way to run custom reports from QuickBooks without Google Sheets that keeps your data live and your reports always current. No exports, no stale snapshots, no manual cleanup before anyone can read the numbers.
TLDR:
- QuickBooks native reports hit limits when you need cross-source data or custom formulas.
- Spreadsheet exports create recurring manual work that extends close cycles by days or weeks.
- 94% of finance teams rely on spreadsheets for close work, directly slowing their timeline.
- Double connects live QuickBooks data to reports with AI variance analysis built in.
- Double centralizes close execution and reporting in one workflow without manual exports.
What QuickBooks Custom Reports Can (and Cannot) Do
QuickBooks Online does give you a real set of customization tools. You can filter by date range, customer, vendor, or class, add and remove columns, adjust groupings, and save report templates for reuse. For straightforward reporting needs, that gets you reasonably far. For more advanced needs, purpose-built reporting tools offer greater flexibility.
The gaps appear fast once your needs grow past the basics. QuickBooks reports pull from a single ledger, so the moment you need to combine data from a payroll processor, a payment tool like Stripe, or a separate entity, the native reports hit a wall. There is no cross-source calculation layer, no conditional logic beyond simple filters, and no way to model scenarios or build custom formulas on top of your ledger data.
What you are left with is a report that covers what QuickBooks knows and nothing more. Any data that lives outside the ledger has to come in manually, which is exactly where Google Sheets enters the picture for most teams.
The Hidden Cost of the Google Sheets Workaround
The Google Sheets workaround feels logical at first. Export your QuickBooks data, paste it into a spreadsheet, build your formulas, and shape the report however you want. Problem solved, right?
Except the export is a snapshot. The moment your books change, your sheet is stale. Someone has to re-export, re-paste, and hope the columns still align. Formulas break. Tabs multiply. Nobody agrees on which version is current.
"The second mountain to climb after the books are closed" is how some controllers describe rebuilding variance analysis in spreadsheets every single month.
The numbers back this up. 94% of finance teams still rely on spreadsheets for close activities, and half cite them as a key reason their close runs slow. Cash reconciliation alone can eat 20 to 50 hours monthly for many teams.
The real cost here is the recurring manual work the tool generates every single close cycle, impacting overall accounting team productivity.
How Manual Reporting Extends Your Month-End Close
The reporting bottleneck shows up directly in your close timeline.
Only 18% of finance teams can close in three days or fewer, meaning 82% are running longer than what the industry considers world-class. Manual reporting is a major reason why. When your QuickBooks data needs to move through exports, spreadsheet cleanup, and manual variance work before anyone can read the numbers, you are stacking delay on top of delay. A structured month-end close checklist can help organize these steps.
Every re-export, every column fix, every "wait, which version is this?" conversation adds hours. Those hours push reporting past the point where it still informs decisions. By the time management sees last month's numbers, the month after is already halfway done.
For finance teams and bookkeeping firms alike, this is a capacity issue. Time spent rebuilding reports manually is time not spent on higher-value work.
QuickBooks Advanced Reporting Features: What You Get (and What You Pay)
QuickBooks Online Advanced, the top-tier subscription, includes two reporting features worth knowing: a Custom Report Builder and Spreadsheet Sync.
The Custom Report Builder lets you create more flexible financial reports with drag-and-drop fields, custom groupings, and additional display options beyond what standard QBO reports offer. Spreadsheet Sync connects your QuickBooks data directly to Excel or Google Sheets, so your spreadsheet refreshes from live data without manual exports.
Both are genuine improvements. Spreadsheet Sync in particular cuts out the copy-paste cycle that plagues most teams, though some organizations have achieved even greater improvements with integrated solutions.
Here is where the gaps remain:
- Spreadsheet Sync still requires a spreadsheet to function, meaning formula maintenance and version control stay on you
- The Custom Report Builder pulls from QuickBooks data only, so cross-source reporting still requires manual assembly
- Neither feature handles variance explanations, narrative, or close workflow integration
- QuickBooks Online Advanced starts around $235/month, a meaningful jump from lower tiers
The upgrade makes sense if your core issue is stale exports. If your reporting bottleneck runs deeper into close workflow, cross-source data, or variance storytelling, the Advanced tier narrows the gap without closing it.
When Custom Reports Actually Need External Tools
Approach | Data Freshness | Cross-Source Reporting | Variance Analysis | Monthly Effort | Best For |
|---|---|---|---|---|---|
QuickBooks Native Reports | Live data from QuickBooks ledger only | Single QuickBooks entity only, no external data sources | Manual analysis required outside the system | Low setup, but limited customization requires workarounds | Basic financial reporting within a single QuickBooks entity |
QuickBooks Online Advanced | Live sync to Excel or Google Sheets with Spreadsheet Sync feature | QuickBooks data only, external sources require manual integration | Must build formulas and narratives in spreadsheet | Reduced export time but ongoing spreadsheet maintenance | Teams needing flexible reporting templates with live QuickBooks refresh |
Manual Spreadsheet Workflows | Stale snapshots after each export, requires re-export for updates | Full flexibility to combine any data sources manually | Rebuild variance formulas and commentary every period | High recurring effort: 20-50 hours monthly for many teams | Complex custom calculations with unique business logic |
Double for Close Management | Live two-way sync with QuickBooks, always current | Connects multiple data sources within integrated workflow | AI-assisted flux analysis with narrative attached to financials | Minimal ongoing effort, variance analysis automated | Teams closing books and producing management reports in one workflow |
Not every reporting gap is a process problem. Some situations genuinely require data assembly that QuickBooks cannot perform on its own.
Multi-entity consolidation is the clearest example. If you manage two or more separate QuickBooks files, there is no native way to roll them up into a single consolidated view. Each entity lives in its own ledger, and combining them requires pulling data out and merging it somewhere else.
A few scenarios where external tools are legitimately necessary:
- Commission calculations tied to custom logic, deal structures, or tiered rates that don't map to any QuickBooks field
- Reports that blend transaction data with non-accounting inputs like headcount, unit counts, or sales pipeline data
- Rolling forecasts or budget-versus-actual models built on assumptions your ledger doesn't store
- Consolidations across mixed accounting systems, such as one entity on QuickBooks Online and another on Xero or NetSuite
If your situation fits one of these, an external tool is the right call. Connected solutions deliver measurable time savings. The question worth asking is whether that tool needs to be a manually maintained spreadsheet, or whether a connected solution can handle the data movement for you.
Where teams get stuck is treating every reporting gap as if it belongs in this category. Variance analysis, flux commentary, close status tracking, and financial narratives are workflow problems, and those have a different solution.
Automation Over Spreadsheets: A Different Approach
The alternative to spreadsheet-based reporting is a system that never needed the export in the first place.
Purpose-built close management tools connect directly to QuickBooks, pulling live ledger data into reports without manual steps in between. Calculation rules apply consistently every period. Variance analysis attaches to the financials as they are built, not after. Close management automation handles these connections natively. The reporting step stops being a separate task and becomes part of how the close runs.
The results are measurable. Organizations using automation have reduced financial close cycles by 40-60% while improving data accuracy by up to 90%. That gap between a spreadsheet-dependent close and an integrated one is not marginal.
How Double Brings Custom Reporting Into Your Close Workflow
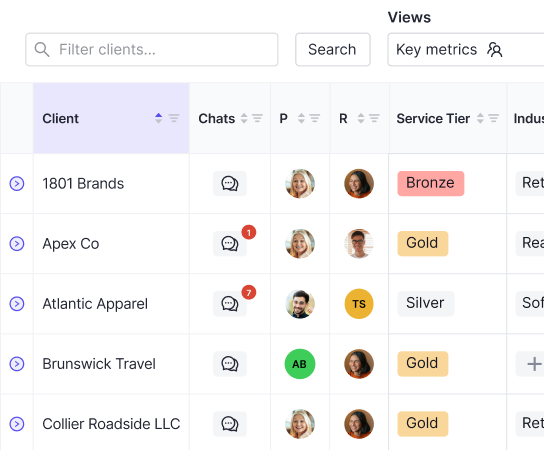
Double connects directly to QuickBooks with a two-way sync, so reports always reflect current ledger data. No exports, no stale snapshots, no column realignment after every close.
The Interactive P&L lets you drill down to the transaction level, attach commentary and footnotes to specific line items, and share finished reports through the client portal or by email. When management asks why a number moved, the variance explanation is already there, attached to the financials instead of buried in a separate spreadsheet tab.
AI-assisted flux analysis handles the narrative work automatically, flagging material changes and generating variance summaries without rebuilding the story from scratch each period. The executive summary travels with the numbers.
For bookkeepers and controllers who have been running a two-step process, close in QuickBooks and then report in Google Sheets, Double collapses that into one workflow. The reporting step stops being extra work and becomes the natural output of a close that was already done.
Final Thoughts on Creating Custom QuickBooks Reports Without Manual Exports
The real reporting problem isn't that QuickBooks lacks features but that most workflows treat reporting as a separate task that happens after the close. When you connect your ledger to a system that builds custom reports from QuickBooks inside the close workflow itself, the export step disappears and your variance analysis travels with the financials. Your close runs faster because reporting stops being extra work. If that sounds like what your team needs, grab a demo slot and we'll show you how it fits together.