
Reports your clients will actually read.
Connect your ledger or ERP and generate a full interactive reporting package, in just a few clicks.
Get started
Trusted by thousands of bookkeepers and accountants

















AI Flux Analysis
Variance analysis that explains itself.
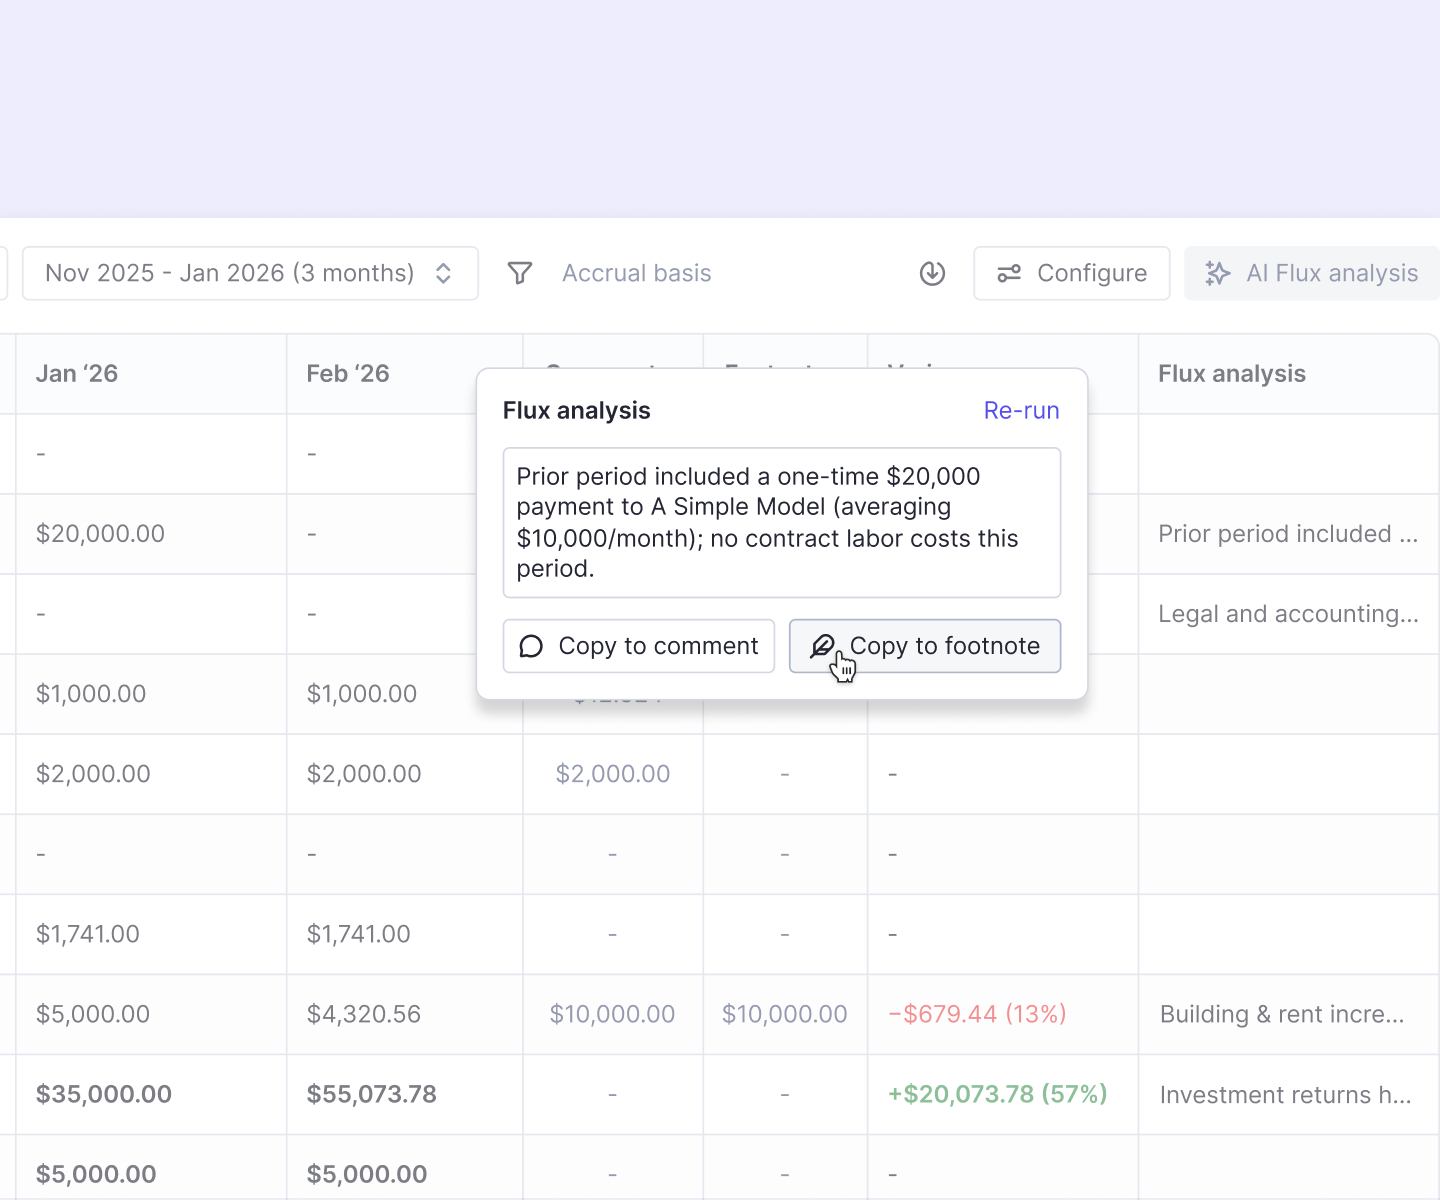
AI Flux Analysis explains each material change at the transaction level, right on your Final Review P&L or Balance Sheet — then drops your edited findings into the footnotes or comments.
The analysis lives where your clients or stakeholders will read it, not in a spreadsheet on the side.
The analysis lives where your clients or stakeholders will read it, not in a spreadsheet on the side.
Available on the Double Scale plan.
Learn more about AI Flux Analysis
metrics
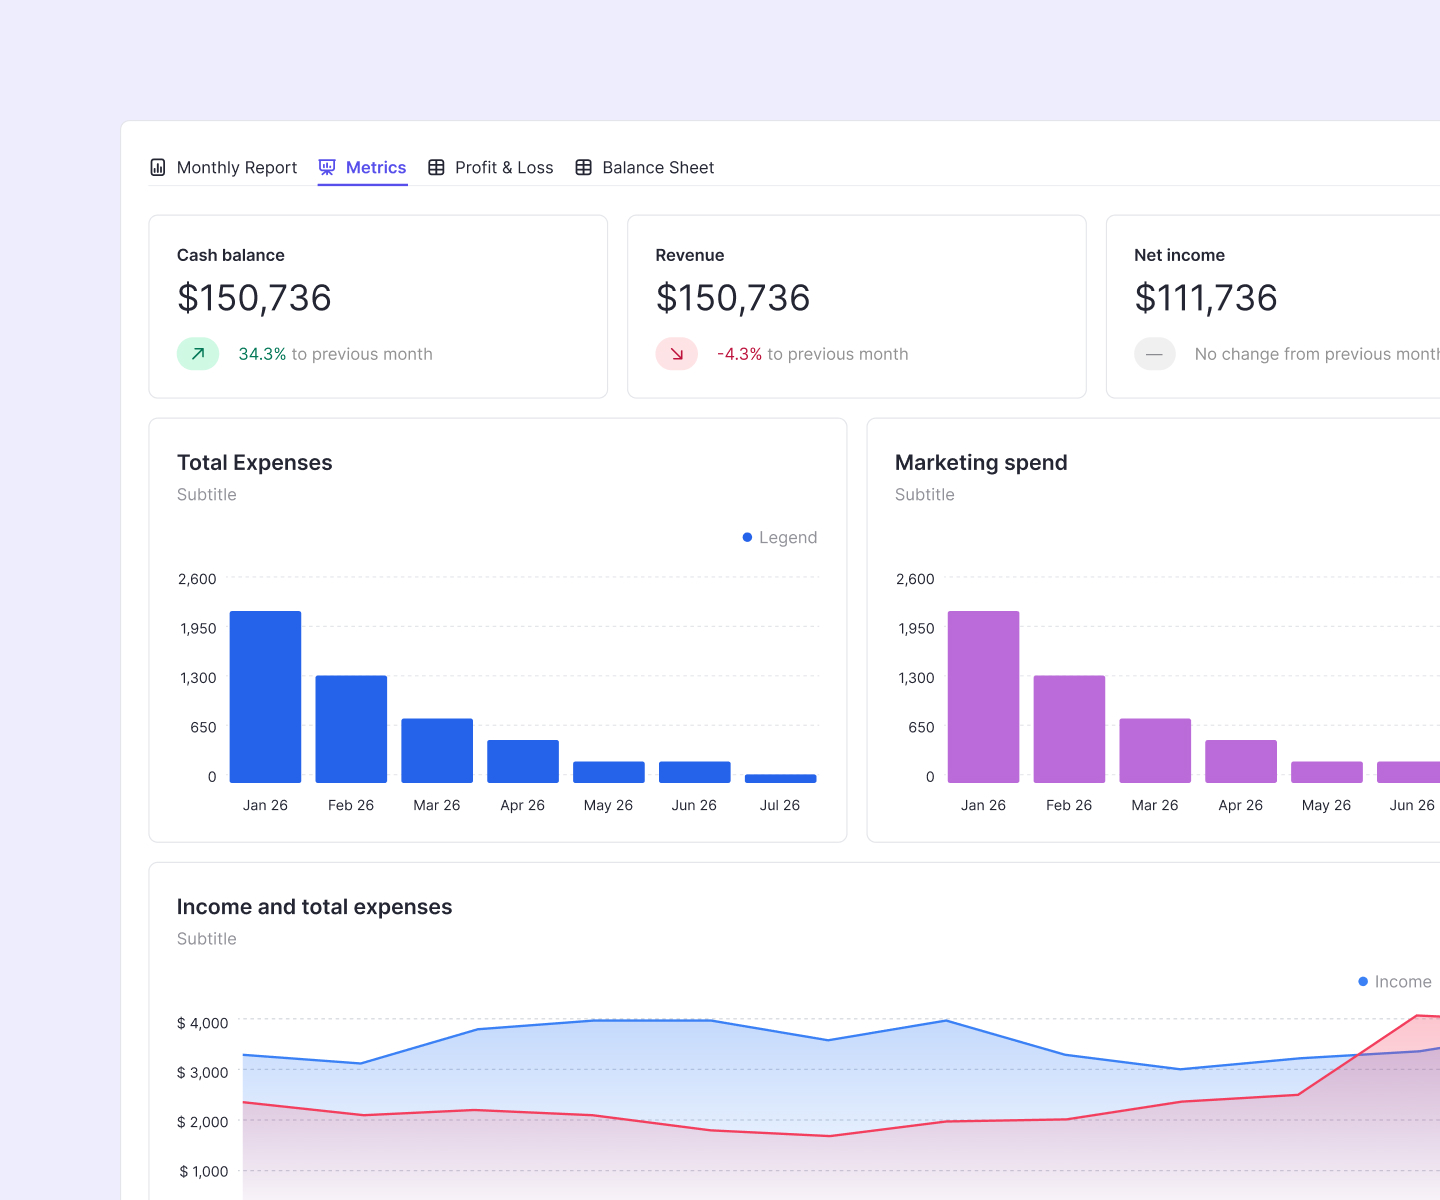
Measure what matters.
Track custom KPIs and metrics that are specific to your client's needs.
Create variables using formulas within Double — these metrics update automatically when your ledger data does.
Generate & customize
Your full reporting package, built from real financial data.
By connecting to your ERP or your client's general ledger, Double can automatically generate a complete reporting package with just a few clicks.
After that, customization is easy: toggle sections, add footnotes, adjust date ranges, and build custom columns or period comparisons that match how your client or stakeholder thinks about the numbers.
AI Financial Summaries
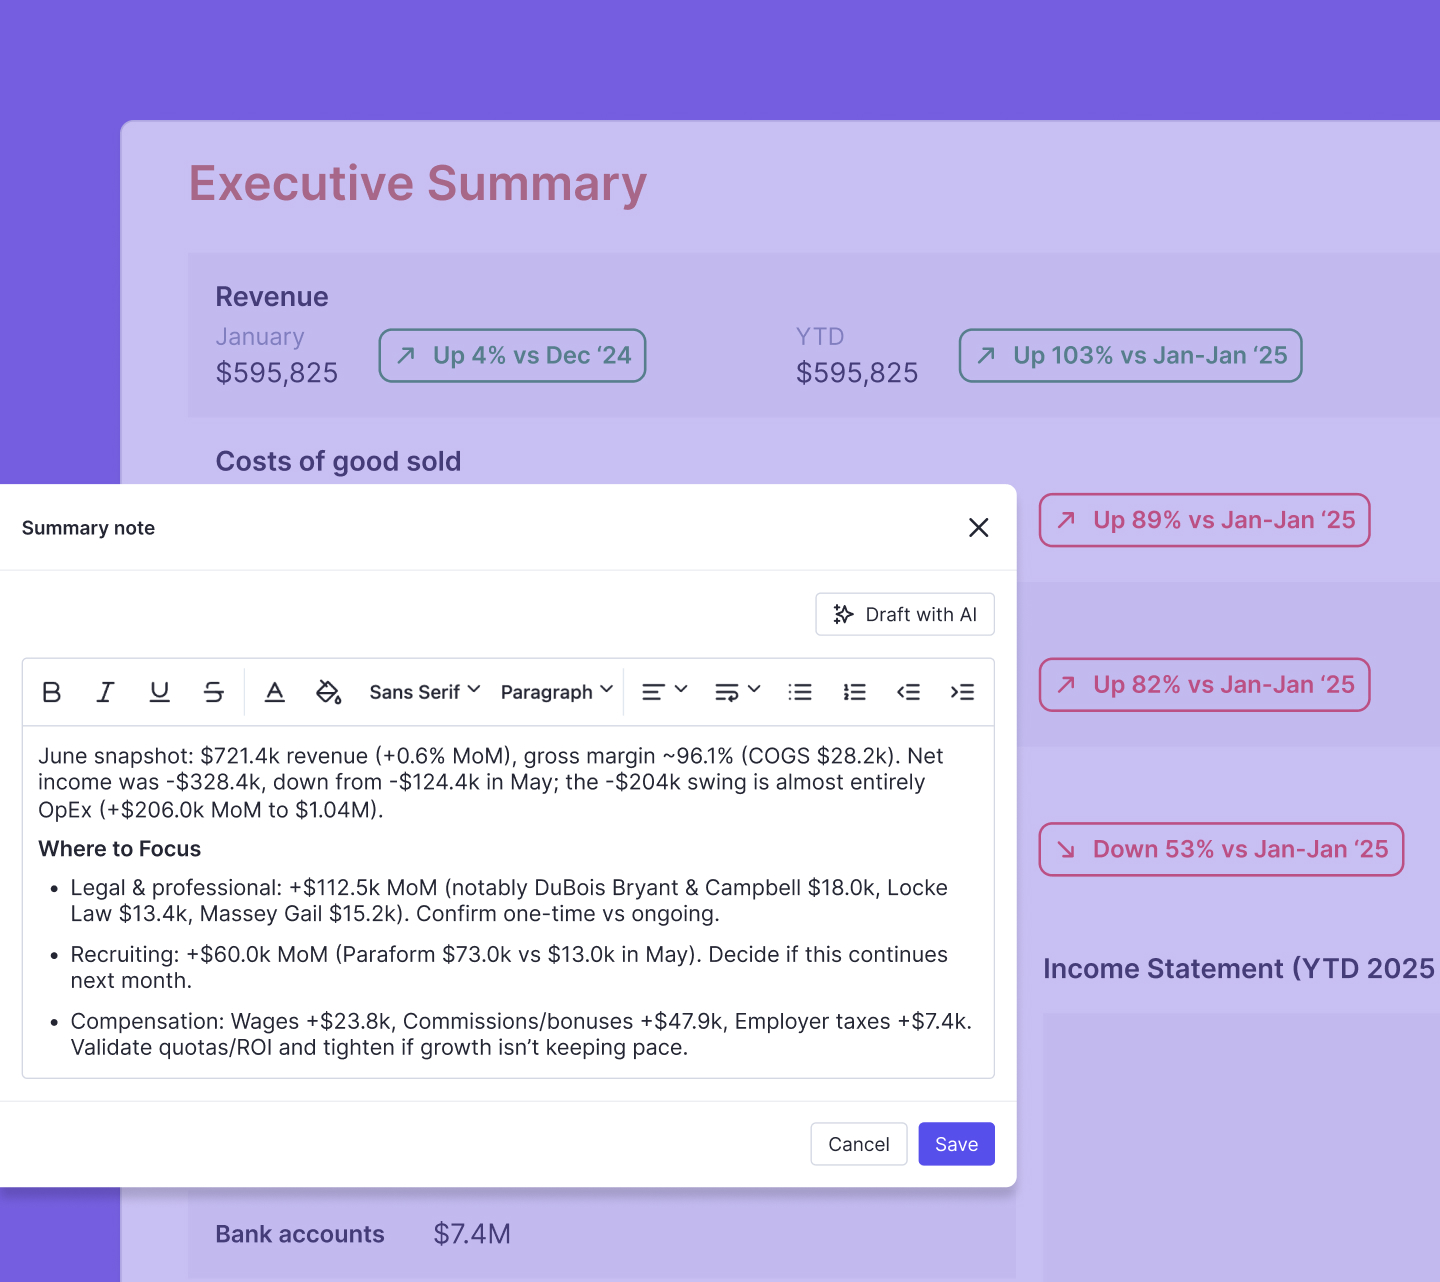
Add instant insights.
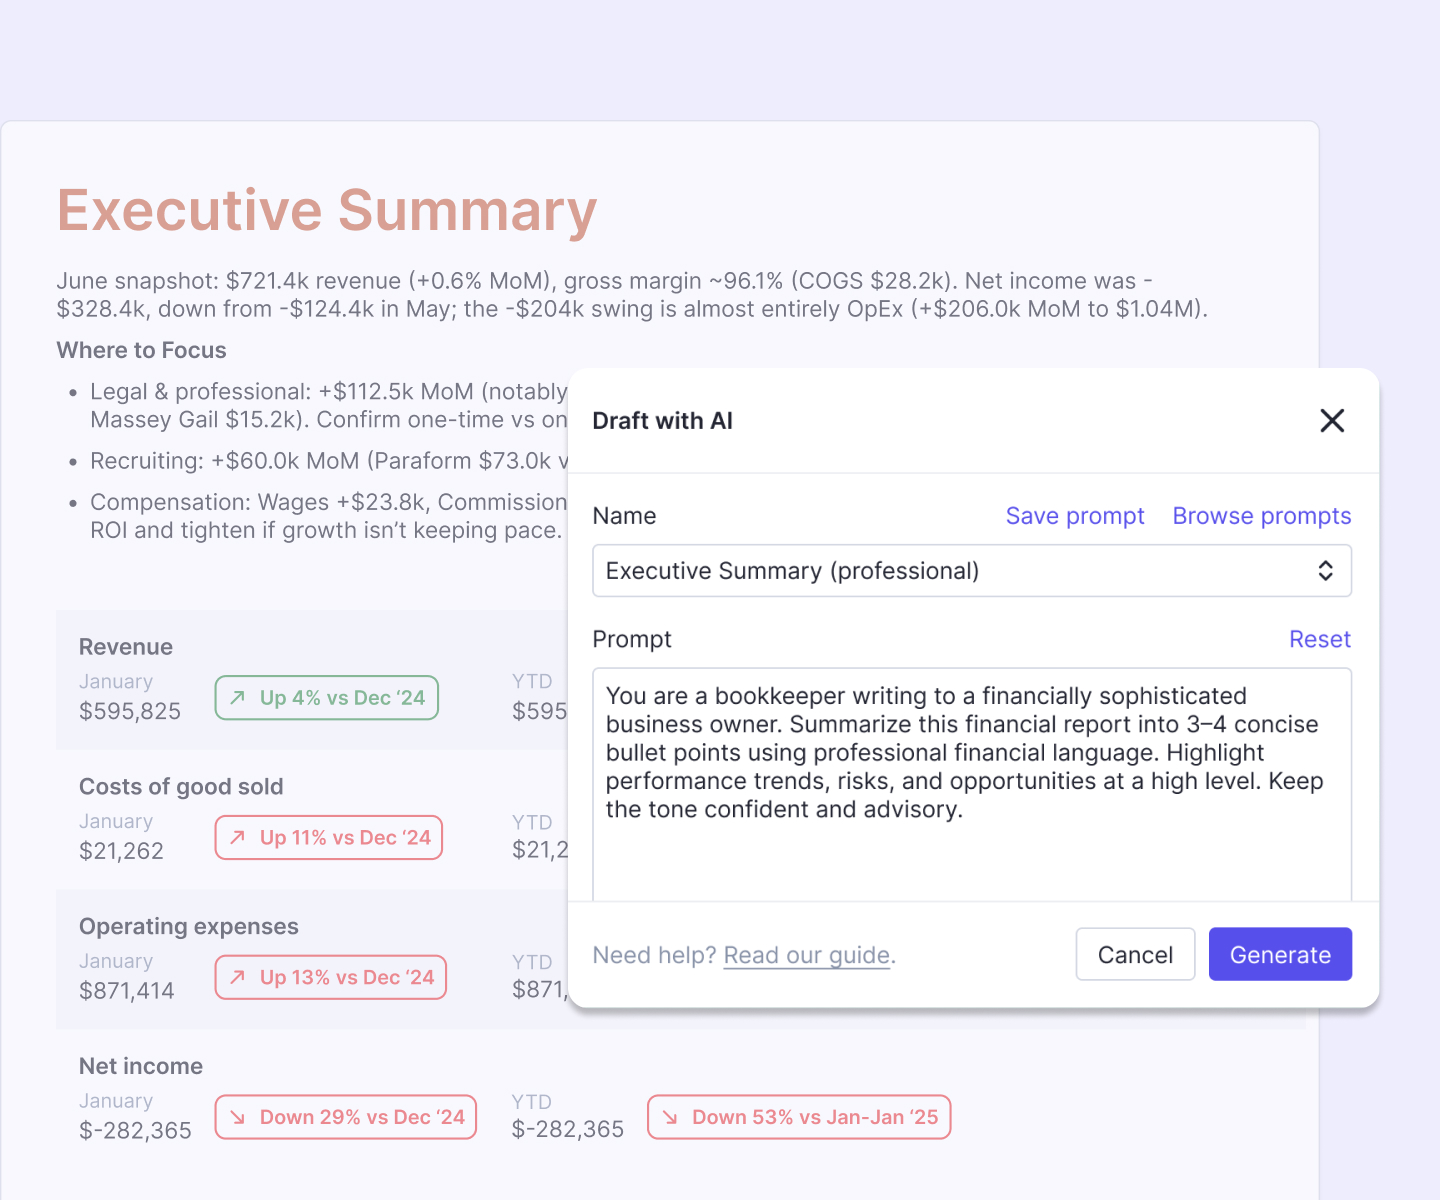
Give clients and stakeholders more than just numbers; give them meaning. Double automatically generates clear, digestible commentary that highlights key trends, variances, and areas to watch.
Flexible prompts make it easy to tailor tone and content per client, and the AI streams its reasoning as it writes, so you can see exactly how it got there before you share externally.
Executive Summary
View financials at a glance.
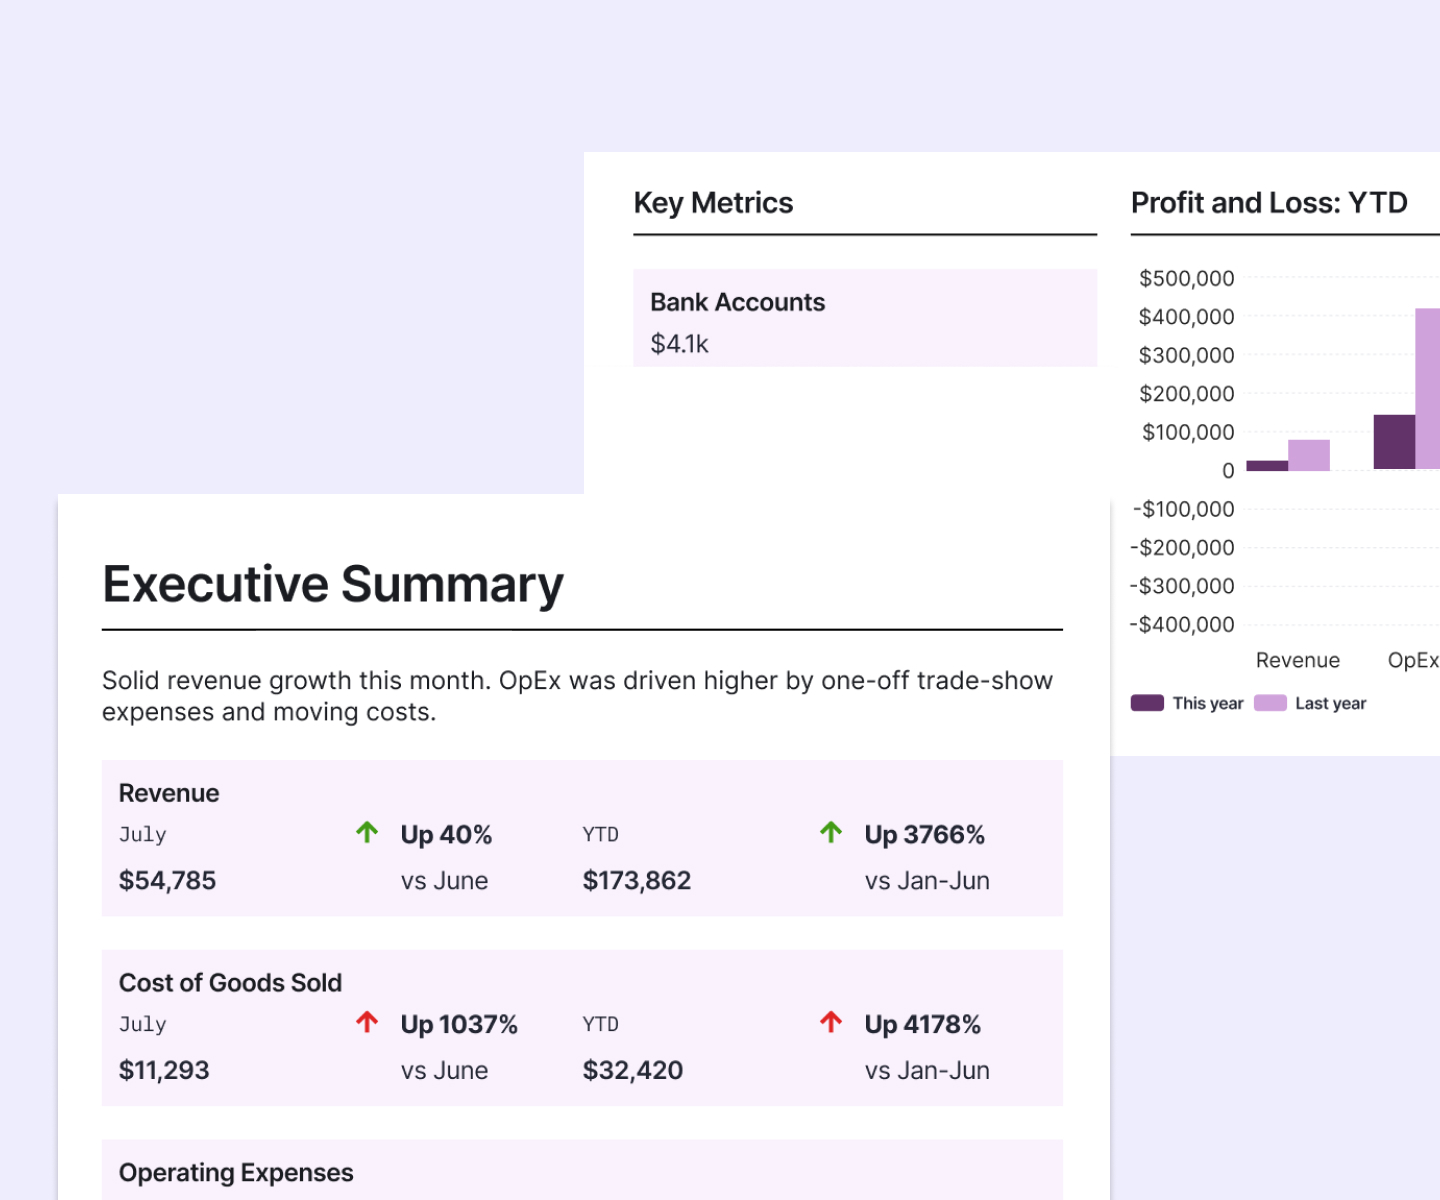
Give your clients and stakeholders a snapshot of their financials that they can easily digest. The Executive Summary sets the stage for the rest of the reporting package, and uses visuals and graphics that help your clients understand the numbers.
Includes:
- AI Financial Summary for the reporting package as a whole
- Profit & Loss comparison against prior date ranges
- Straightforward key metrics that your clients care about most
- Profit & Loss bar chart to measure against the previous year
- AI Financial Summary for the reporting package as a whole
- Profit & Loss comparison against prior date ranges
- Straightforward key metrics that your clients care about most
- Profit & Loss bar chart to measure against the previous year
PUBLISH
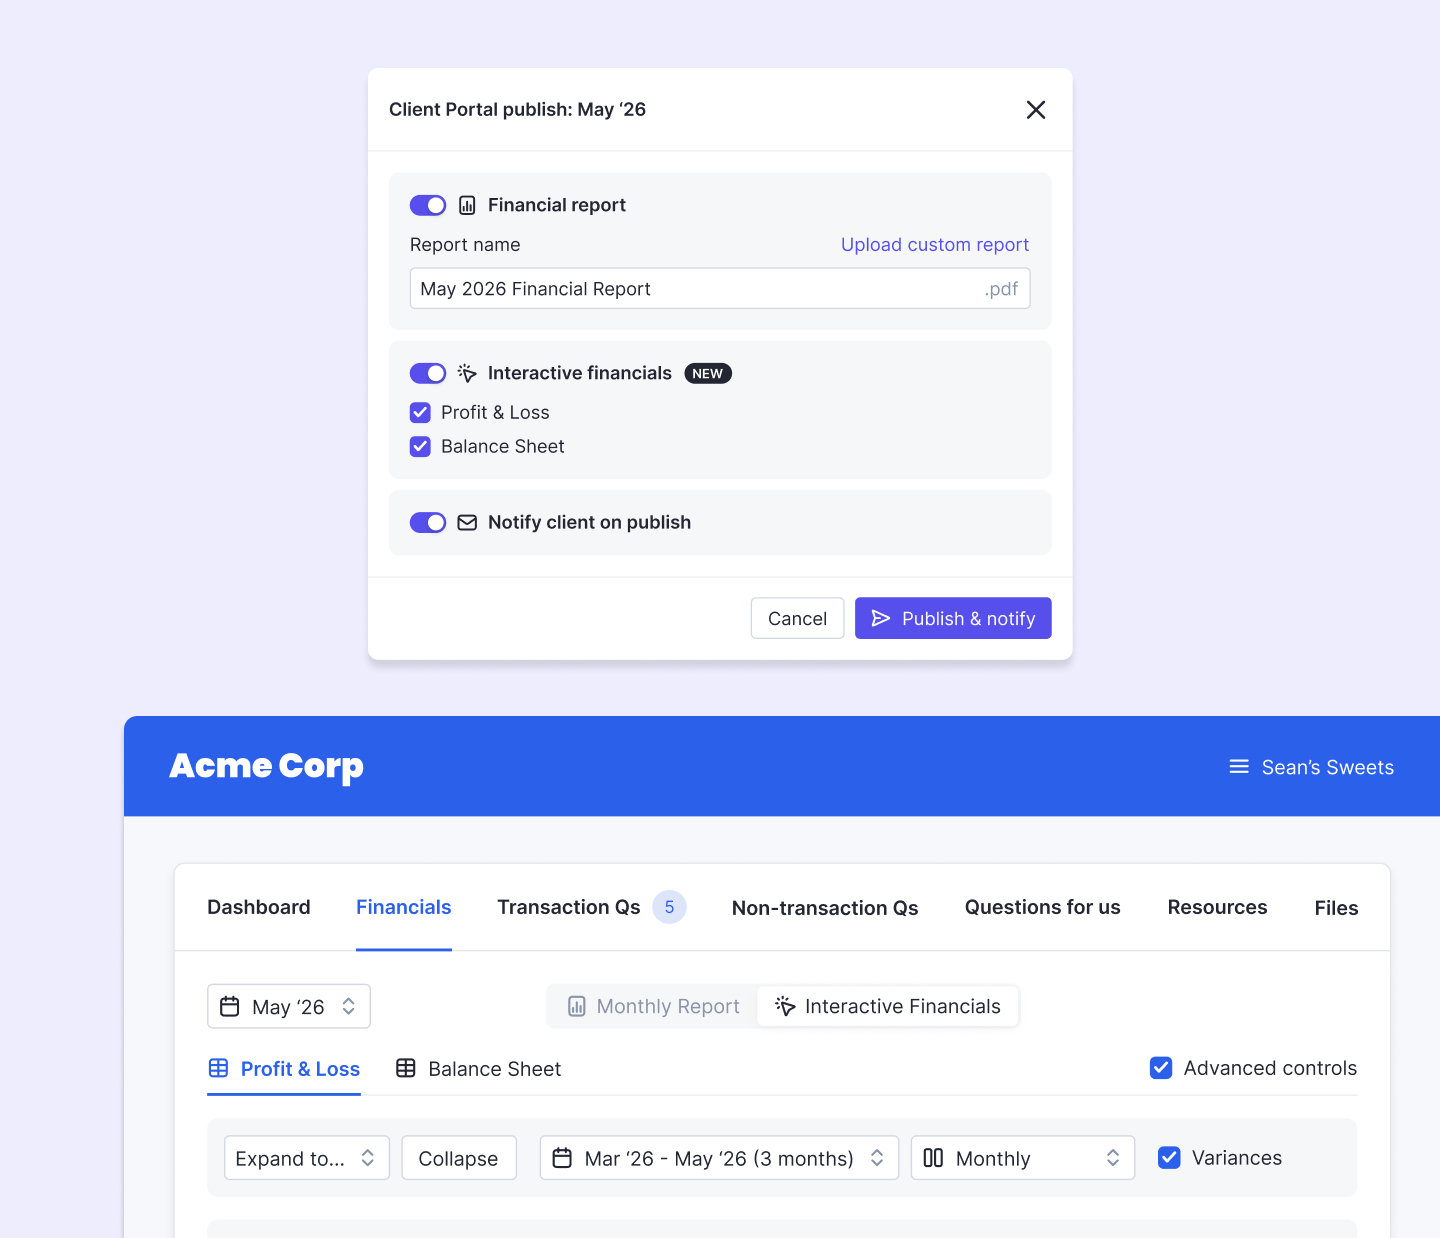
Reports clients can open, explore, and ask about.
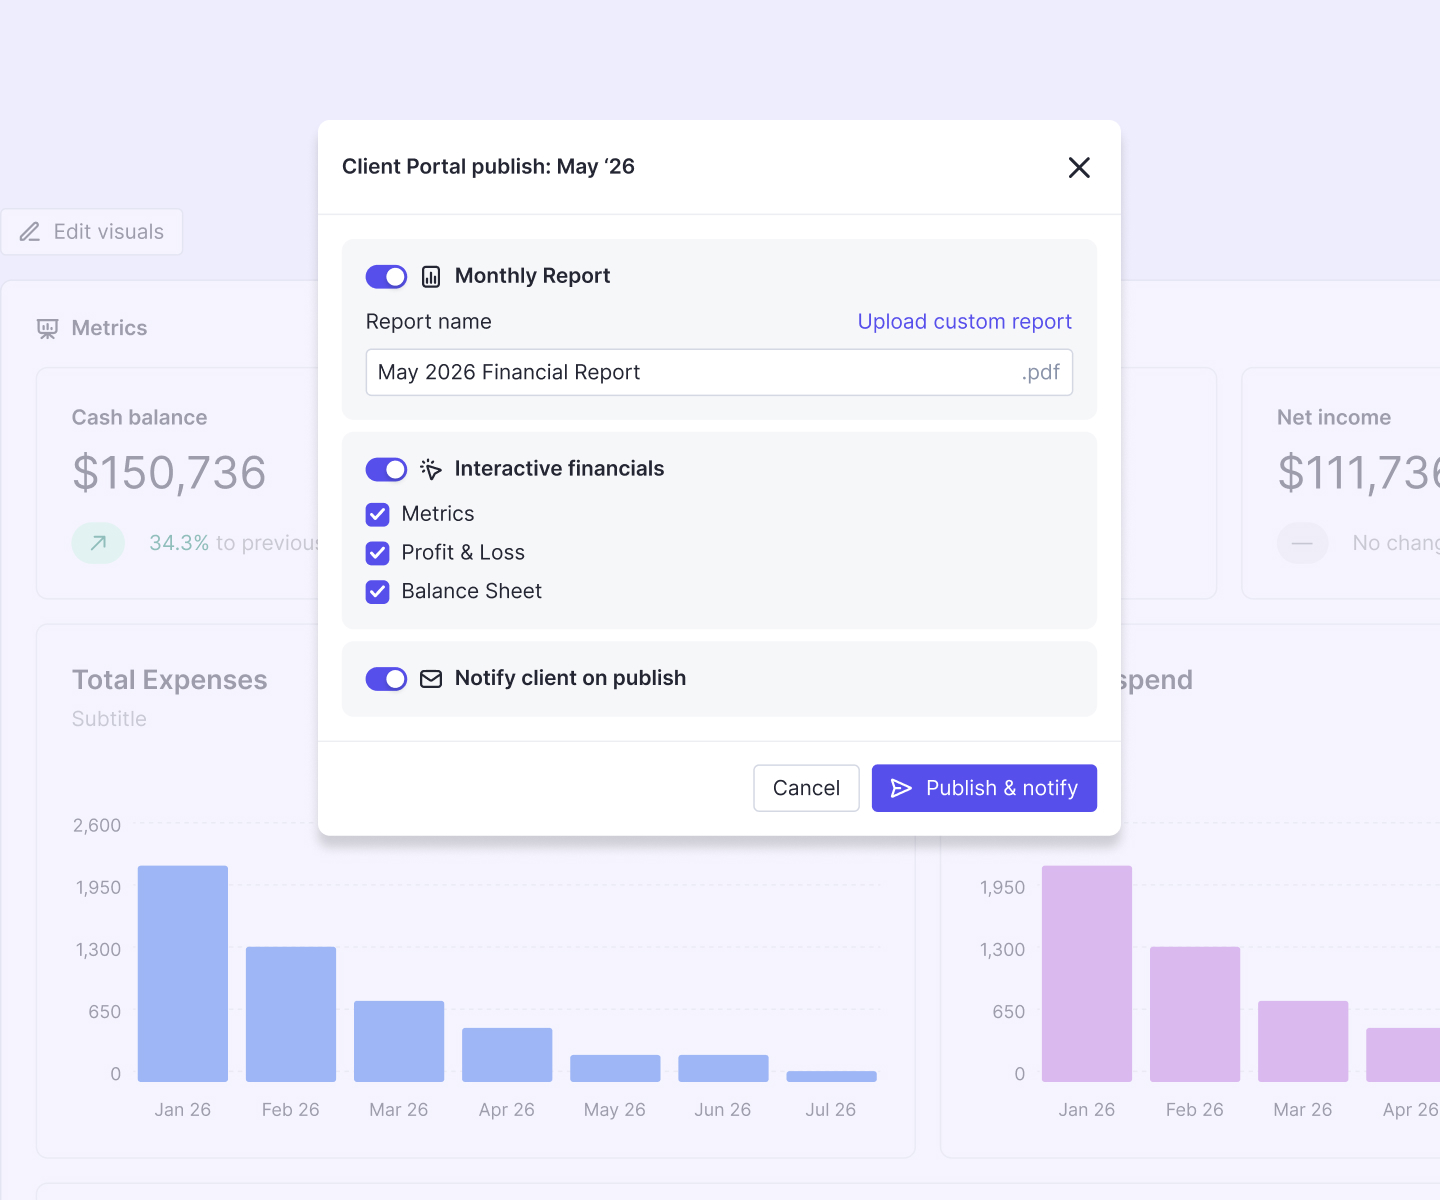
When you're finished reviewing and customizing, publish to the Client Portal, email, or print to PDF in one click. Clients get notified, and every report is stored securely in the portal for future reference.
Double’s interactive reports let clients explore their numbers, and when something raises a question, they can ask it right from the Financials tab.
Explore Client Portal